mirror of
https://github.com/Doctorado-ML/Stree_datasets.git
synced 2025-08-17 08:26:02 +00:00
4.0 KiB
Executable File
4.0 KiB
Executable File
<HTML>
<HEAD>
</HEAD>
 (A) Downward Trend. (B) Cyclic. (C) Normal. (D) Upward Shift. (E) Upward Trend. (F) Downward Shift.
The UCI KDD Archive
Information and Computer Science
University of California, Irvine
Irvine, CA 92697-3425
Last modified: June 14, 1999 </HTML>
Synthetic Control Chart Time Series
Data Type
time seriesAbstract
This data consists of synthetically generated control charts.
Sources
Original Owner and Donor
Dr Robert Alcock
rob@skyblue.csd.auth.gr
Date Donated: June 8, 1999
Data Characteristics
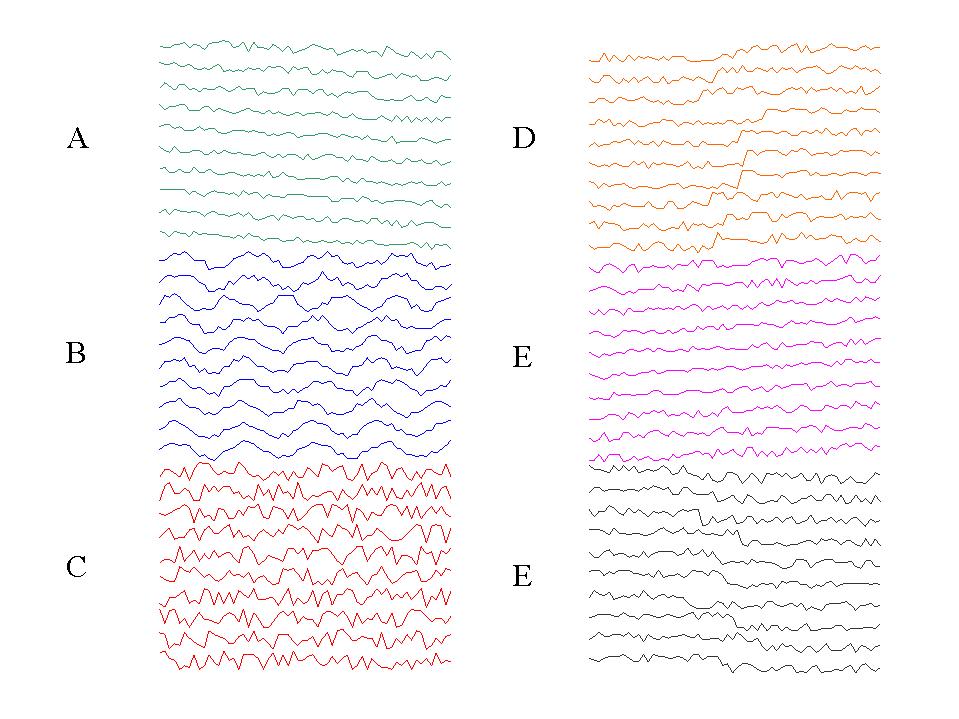
This dataset contains 600 examples of control charts synthetically generated by the process in Alcock and Manolopoulos (1999). There are six different classes of control charts:
- Normal
- Cyclic
- Increasing trend
- Decreasing trend
- Upward shift
- Downward shift
The following image shows ten examples from each class:
 (A) Downward Trend. (B) Cyclic. (C) Normal. (D) Upward Shift. (E) Upward Trend. (F) Downward Shift.
Data Format
The data is stored in an ASCII file, 600 rows, 60 columns, with a single chart per line. The classes are organized as follows:1-100 Normal 101-200 Cyclic 201-300 Increasing trend 301-400 Decreasing trend 401-500 Upward shift 501-600 Downward shift
Past Usage
Alcock R.J. and Manolopoulos Y. Time-Series Similarity Queries Employing a Feature-Based Approach. 7th Hellenic Conference on Informatics. August 27-29. Ioannina,Greece 1999.
Acknowledgements, Copyright Information, and Availability
Image courtesy of Eamonn Keogh.References and Further Information
D.T. Pham and A.B. Chan "Control Chart Pattern Recognition using a New Type of Self Organizing Neural Network" Proc. Instn, Mech, Engrs. Vol 212, No 1, pp 115-127 1998.
The UCI KDD Archive
Information and Computer Science
University of California, Irvine
Irvine, CA 92697-3425
Last modified: June 14, 1999 </HTML>